
A QUICK AND DIRTY GUIDE
TO DATA MATURITY
You’re probably familiar with the concept of data maturity — a measurement of how well an organization uses its data — and the maturity models that go along with it.
Understanding your current level of data maturity is the first step toward improving it. But the way you interpret and apply data maturity models might actually be hindering your success.
It’s tempting to look at a maturity model as a straightforward tiered system — your organization exists in one category, and your goal is to move up to the most mature category. But particularly for larger organizations, things aren’t so clear-cut. It’s common for different departments or business units to be at different maturity levels. Additionally, too many organizations get caught up in the long-term goal of data maturity and miss out on opportunities to create value at every maturity level.
In this article, we’ll go over the four categories we use to assess data maturity, give examples of challenges that arise in each category, and offer recommendations for driving more value at that level.
Before we get started, here’s a summary of each category for context:
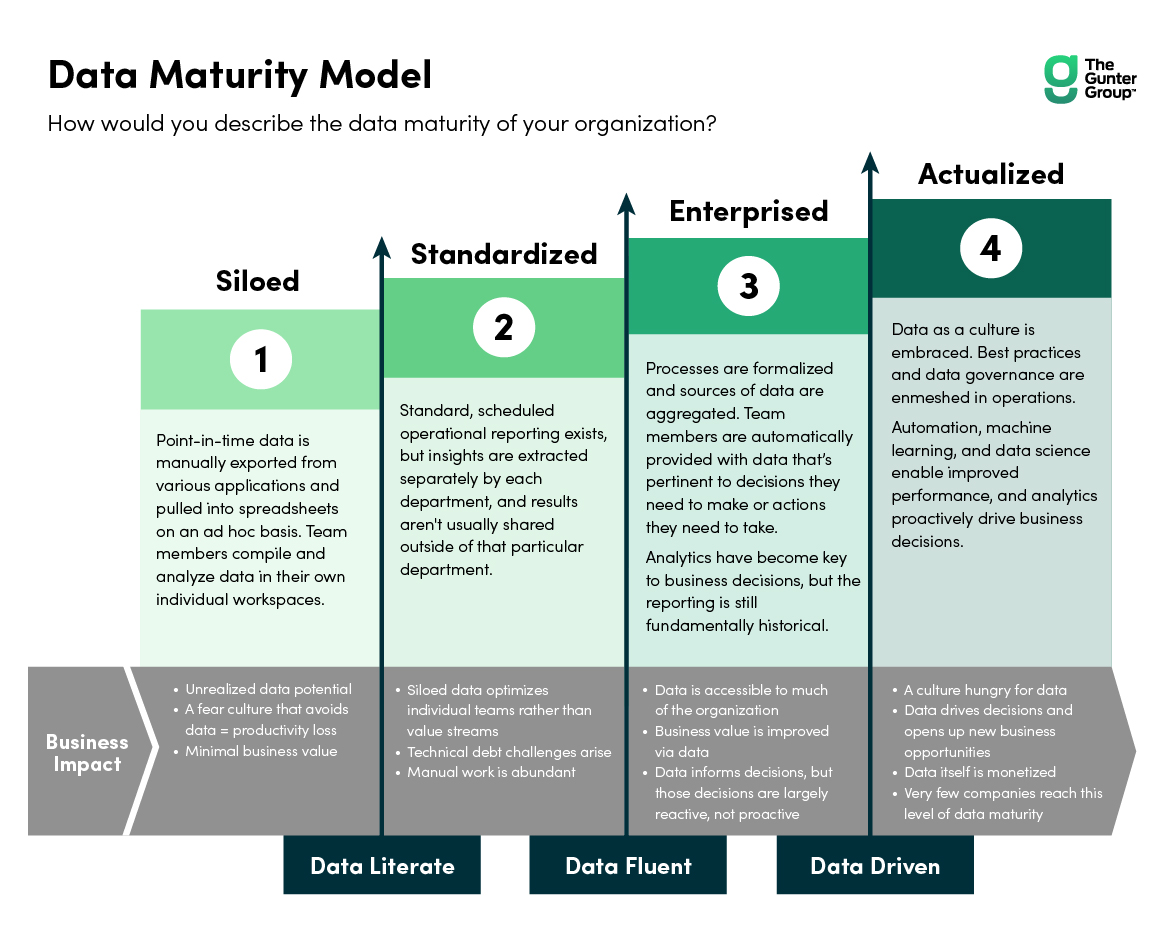
Note: As you consider where you fall, it’s important to be realistic — think about where you are right now, not where you hope to be after completing a particular project. It’s also helpful to remember that it’s rare for an entire organization to exist within a single category. In most cases, different departments and teams will have different maturity levels.
Siloed
What it looks like:
Point-in-time data is manually exported from various applications and pulled into spreadsheets on an ad hoc basis. Team members compile and analyze data in their own individual workspaces (e.g. a spreadsheet only you have access to, or a platform that’s only used by one particular team).
Finding data requires some exploration — team members are not always sure where to look or who to ask for the data they need. They often end up emailing or asking around until they find someone who has what they’re looking for.
Example of a challenge:
You’re planning to hire people for a new team, and want to use a data-driven recruiting approach. You need access to key data about past recruiting efforts, like cost per hire, time to fill, recruiting yield ratios, and first-year attrition, so you send an email to HR requesting the information. HR then needs to take the time to locate and compile the data into a spreadsheet and send it to you.
Because you don’t have immediate access to the data you need, the recruiting process is already slowed down, and it will take longer to get your new team filled.
How to drive more value:
The importance of business process management can’t be overstated. For a process that will undoubtedly need to be repeated in the future (like looking at recruiting data), it’s important to start out with a deep, thorough understanding of the process itself. The first step to creating a repeatable environment is understanding what you want to repeat and why — then you can work on implementing more efficient processes.
Standardized
What it looks like:
Your organization has standard, scheduled operational reporting. You don’t have to go on an expedition every time you need data, because you know that you can find it in the most recent report (however, you’re still manually pulling data from that report). Even if you’re creating useful insights, they tend to stay with you — they’re not shared with other teams or business units.
Example of a challenge:
Each week, everyone in your department receives an email with an automated report that covers POS data. Most of the time, you don’t find anything in the report that’s actionable for you, so you sometimes don’t even open it.
When you do read it, you have to comb through tons of data to find anything relevant and manually extract it, which is time-consuming and inefficient. You complete analyses that are important to you within your own workspace, and the results aren’t usually shared outside of your immediate department.
How to drive more value:
Once you know where to find your data, determine what makes it actionable and relevant — and who needs to see it. As a starting point, ask yourself the following questions:
- What decisions do I need to make, and how can this data inform those decisions?
- What’s the ideal way for me to receive and view this data?
- Who else would benefit from seeing this data?
- How can data be efficiently shared across departments so everyone has access to what they need?
Enterprised
What it looks like:
When a particular threshold that’s relevant to your job is met, you automatically receive the relevant information. Rather than getting a standardized report that may or may not contain information you care about, you get notified only when there is data pertinent to a decision you need to make or action you need to take — whether that data is related to a budget milestone, warehouse stock, page views, or something else.
Sources of data are aggregated, so when you need insights, you don’t have to manually combine and analyze data. However, the reporting is still fundamentally historical and often comes too late to help you make informed decisions.
Example of a challenge:
You’re responsible for mapping out an upcoming seasonal campaign and need sales data to inform your plan. Each week, you receive an automatic report containing data that helps you shape the campaign, but you have no way of looking forward in time — you’re stuck with a decision-making process that is reactive, not proactive.
How to drive more value:
With the right timing, data can be leveraged to achieve better outcomes (and predict possible future outcomes). Don’t just think about what data you need and where to find it — think about when it will have the biggest impact on decision-making, and how it can help you course correct before things get off track.
Actualized
What it looks like:
Your data is set up to model and predict future outcomes, perhaps using AI tools like predictive analytics and decision algorithms. Analysts and data scientists are an integral part of the business vision, and insights are created by the company (not requested by specific business leaders).
For many companies in this realm, the data model is inextricably linked with the product or service they provide. For example, platforms like Netflix and Spotify are rooted in predictive data analytics and the ability to make personalized recommendations to customers.
Very few companies reach this level of data maturity — and the reality is, not every company needs to. It takes continuous investment to maintain an Actualized data system and depending on the products and/or services you provide, it might not deliver enough ROI to justify spending the resources and effort.
Example of a challenge:
Your organization is experiencing a slight decrease in customer retention. You already have access to real-time data and analytics that help you understand the problem, but you want to leverage that data in new ways in order to make more informed decisions.
How to drive more value:
Being an Actualized organization doesn’t mean you’ve crossed the data maturity finish line — in fact, there is no finish line.
Only the most advanced companies make it to this level, which means competition is stiff. And considering the incredibly fast pace of data technology, companies that don’t continuously innovate will be left behind.
At this stage, optimization is key. Consider how data can better drive decisions and open up new opportunities for your organization. In the case of the challenge above, building new algorithms for churn models could help guide decision-making and reveal more actionable data.
Conclusion
Identifying your current data maturity level and setting goals for improvement is all well and good, but without taking steps to get more value from your data at your current level, your long-term progress may stall out.
Rather than thinking of data maturity models as rigid paths with set destinations, use them as way-finding tools. Once you understand where you are, you can move forward — no matter what “forward” looks like for your organization.
Regardless of your maturity level, we can help you get more value from your data. Discover how to improve your data infrastructure and decision-making with our Data Maturity Assessment.